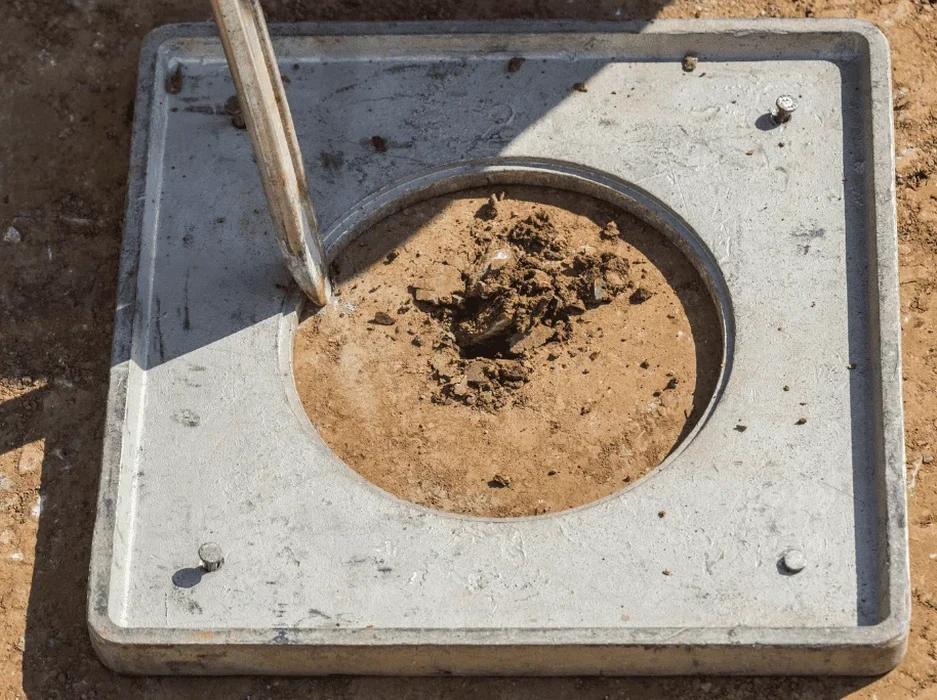
A 14-storey residential development on the Don Valley floodplain was halted last autumn when borehole logs revealed a 4 m layer of loose, saturated alluvial sand at 6 m depth. The structural engineer needed to know whether this material would liquefy under the seismic design case specified by the UK National Annex to BS EN 1998-1. We mobilised within 48 hours, recovered high-quality undisturbed samples using thin-walled Shelby tubes, and ran a suite of stress-controlled cyclic triaxial tests at our UKAS-accredited laboratory in Rotherham. The results showed that the sand’s cyclic resistance ratio was below the seismic demand, triggering a redesign of the foundation system to include stone columns for densification before piling. That kind of rapid, site-specific assessment is what separates generic desk-study seismicity checks from a defensible liquefaction analysis. Our team has applied the same approach across Sheffield, from the River Sheaf corridor to the industrial fills of the Lower Don, where groundwater typically sits within 2 m of ground level and the combination of high water table and granular alluvium creates conditions that demand careful evaluation. We follow the stress-based simplified procedure formalised by Youd and Idriss, adapted for UK seismicity, and always correlate results with CPT data where cone resistance profiles are available to refine the factor of safety against liquefaction triggering.
Liquefaction is not just a seismic trigger problem in Sheffield; it is a groundwater and fines-content problem that demands cyclic laboratory testing, not just SPT correlations.
Process and scope
Sheffield’s industrial expansion in the 19th century reshaped its subsurface as much as its skyline. The steelworks and mills that lined the Don and its tributaries left behind a legacy of made ground, hydraulic fill, and rerouted watercourses that now underlie much of the city centre and the Kelham Island district. When we carry out a liquefaction analysis, we cannot rely on textbook soil behaviour alone because the stratigraphy here often includes slag-rich fills, ash deposits, and reworked alluvium with fines contents that vary sharply over short distances. A site near the Wicker arches, for example, showed 30 % fines in the upper sand but less than 8 % at 8 m depth—a contrast that shifted the cyclic resistance by a factor of 1.6. We characterise these layers using
grain size analysis combined with Atterberg limits to separate clay-like from sand-like behaviour, applying the Boulanger and Idriss (2014) fines content correction. Our laboratory operates to BS 1377 and ASTM D5311 standards, and every sample is logged under ISO 17025 quality management so that the data can withstand scrutiny from NHBC warranty providers or the local authority building control. In the Don Valley, where the drift thickness can exceed 15 m, we also run
MASW surveys to measure Vs profiles and compute the site classification per BS EN 1998-1, because a Type D soil profile amplifies ground motion and increases the liquefaction demand on granular layers that might otherwise be considered marginally stable.
Local geotechnical context
The British Geological Survey maps the Don Valley alluvium as a high-permeability granular deposit with a shallow water table, often perched within 1.5 m of the surface during winter months. In a seismic event—even a moderate one originating from the Pennine fault system—pore-water pressure can rise faster than it dissipates, and loose silty sand can lose effective stress entirely. We have seen borehole data from the Sheffield canal basin where the SPT N-value was just 6 blows at 4 m depth; applying the Seed simplified procedure, that soil would liquefy at a peak ground acceleration of only 0.05 g, which is within the design envelope for a 475-year return period. The risk is not uniform across the city: the Carboniferous sandstone bedrock is shallow in the west near the Hallamshire Hospital, but deepens to over 20 m in the east, amplifying spectral accelerations at the surface. We quantify this variability with site response analysis and present the results as liquefaction potential index maps that civil engineers can use directly in foundation design. Where the factor of safety drops below 1.0, we work with the design team to evaluate ground improvement options, referencing the FHWA-NHI ground modification manual and our own case history from a warehouse project near Meadowhall where vibrocompaction raised the relative density from 35 % to over 70 % and eliminated the liquefaction hazard.
Questions and answers
Is liquefaction a real risk in Sheffield given the low seismicity?
Yes, and the risk is often underestimated. Sheffield sits in a region where the UK National Annex to BS EN 1998-1 assigns a design ground acceleration of 0.04–0.06 g for a 475-year return period. While this is modest compared to active tectonic margins, the combination of loose alluvial sands, a shallow groundwater table in the Don Valley, and a site class D amplification can produce cyclic stress ratios that exceed the soil’s cyclic resistance. We have measured CRR values as low as 0.10 in silty sands near the city centre, which leaves a narrow margin of safety even at UK seismic demand levels.
What is the cost of a liquefaction analysis for a typical Sheffield site?
A complete liquefaction assessment for a single residential or commercial site in Sheffield generally ranges from £1,900 to £3,300, depending on whether cyclic triaxial testing is required or whether the analysis relies on SPT/CPT correlations alone. A screening study using existing borehole data and SPT-based correlations sits at the lower end, while a full programme including undisturbed sampling, three cyclic triaxial tests, MASW for Vs30, and a detailed interpretative report with settlement estimates falls at the upper end.
How long does a liquefaction analysis take from investigation to report?
A field investigation with CPT or SPT boreholes and undisturbed sampling typically takes 3 to 5 working days on site. Laboratory cyclic triaxial testing adds approximately 4 to 6 weeks due to the consolidation and staged loading protocol required by ASTM D5311. The interpretative report with factor of safety profiles and settlement estimates is delivered within 2 weeks of receiving the final lab data. In total, you should allow 8 to 10 weeks from mobilisation to final report.
Do you need cyclic triaxial tests or can you use SPT correlations alone?
SPT-based correlations per Youd and Idriss are acceptable for a screening-level assessment, and we use them frequently for early feasibility studies. However, the Sheffield subsurface often contains silty sands with fines contents between 10 % and 35 %, where the fines correction introduces significant uncertainty. For Category II and III structures under Eurocode 8, we strongly recommend at least one cyclic triaxial test on an undisturbed sample to calibrate the site-specific CRR curve. The cost of the test is modest compared to the foundation redesign that may be avoided.
What ground improvement methods do you recommend if liquefaction is confirmed?
The choice depends on the depth and thickness of the liquefiable layer, the site access constraints, and the structural loading. In Sheffield, we have successfully specified vibrocompaction for clean sands up to 12 m depth, stone columns where fines content exceeds 15 % and drainage is needed, and deep soil mixing for sites adjacent to existing structures where vibration must be minimised. We provide the performance specification and post-treatment verification testing, including CPT before and after improvement.